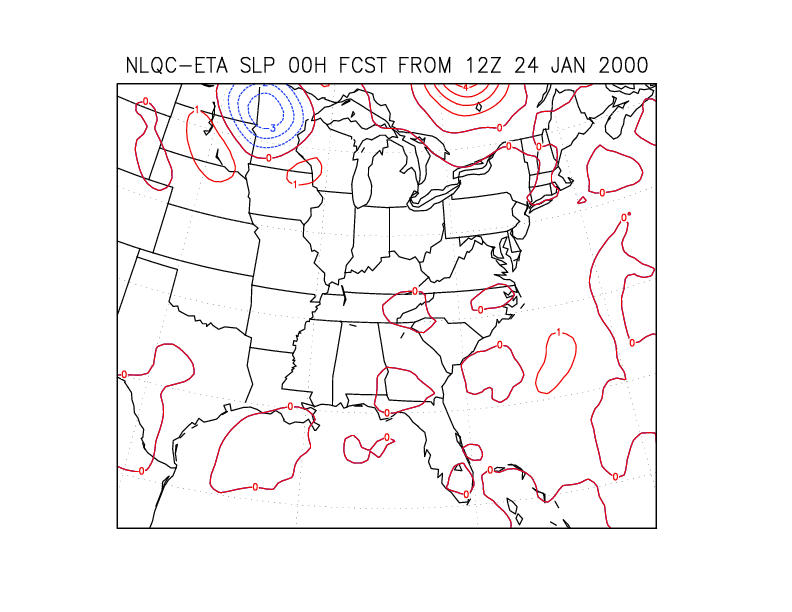
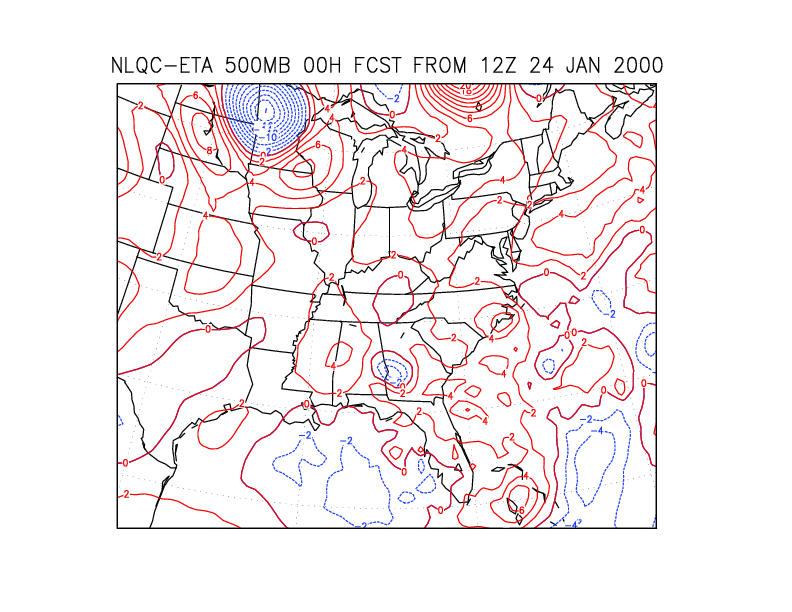
Figure 13: Sea level pressure (left, mb) and 500 mb height (right, m) difference between analyses with and without non-linear quality control for 1200 UTC 24 January 2000.
| |
Figure 13: Sea level pressure (left, mb) and 500 mb height (right, m) difference between analyses with and without non-linear quality control for 1200 UTC 24 January 2000. |