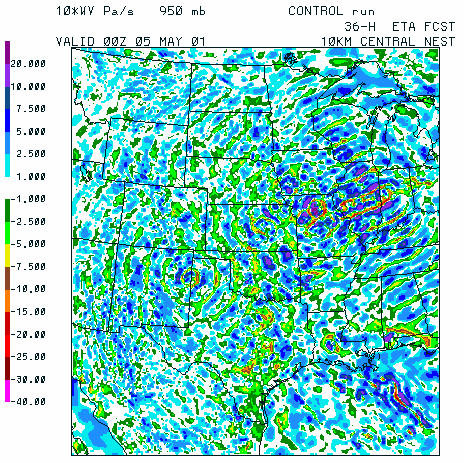
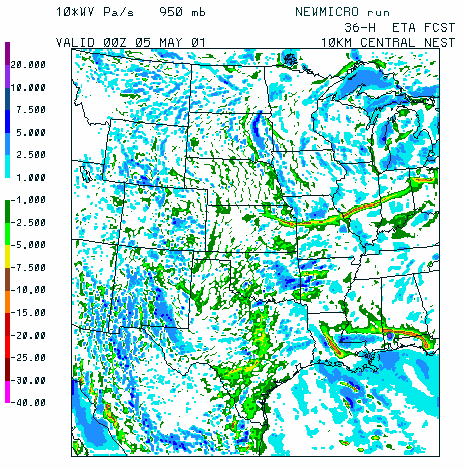
Figure 3.7 36-h forecasts of the 950-mb vertical motion fields valid at
00Z on 5 May 2001 from runs using the Eta 10-km central nest are shown for the
operational control (left) and the new grid-scale microphysics (right). The
vertical motion is expressed in 10*Pa/s, which is roughly equivalent to units of
cm/s, such that a value of 1.0 in the figure is associated with 0.1 Pa/s.
Negative values denote upward motion. Spurious gravity waves in the operational
control run are forced by three areas of intense precipitation, one in the Texas
panhandle along the border with New Mexico, the second over northern Missouri, and
the third along the line of precipitation over central Illinois and Indiana (see
Fig. 3.6). The waves are produced by periodic updates of temperature by cloud
processes in the operational control run, and they are absent in the new model
because temperature is continuously updated every time step.