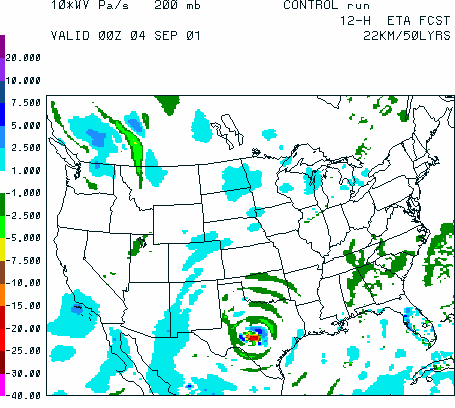
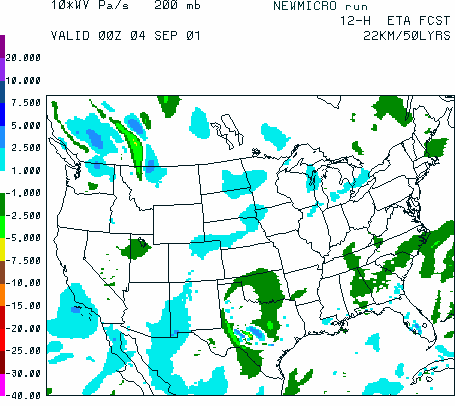
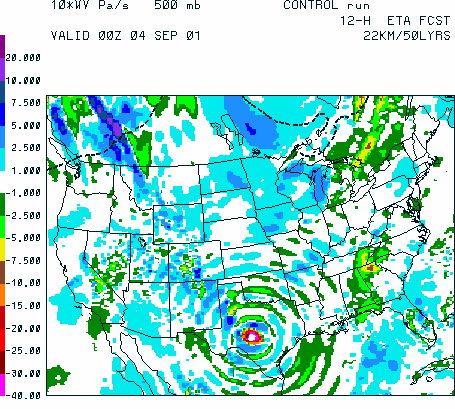
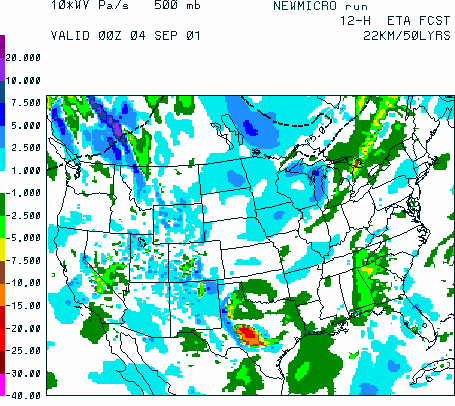
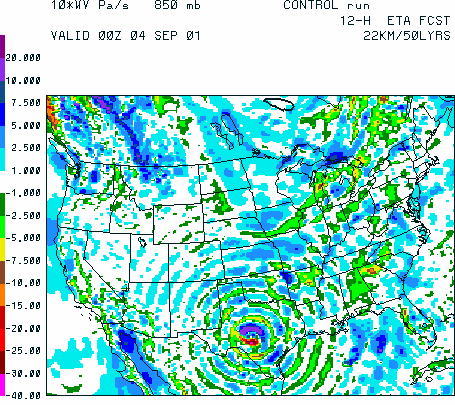
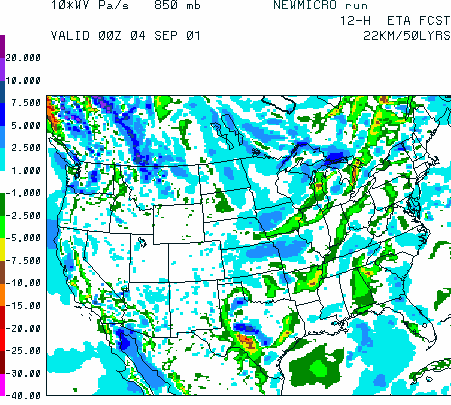
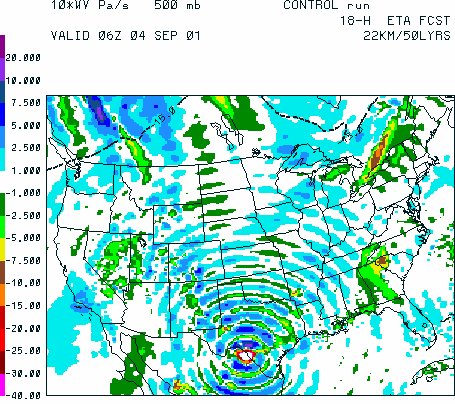
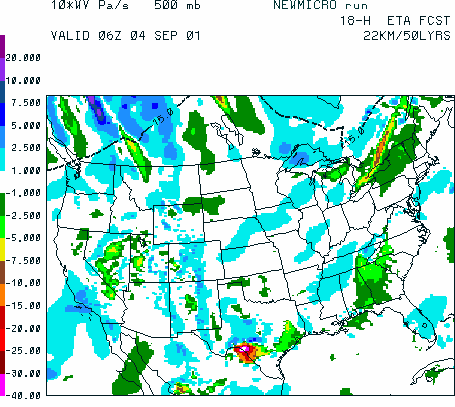
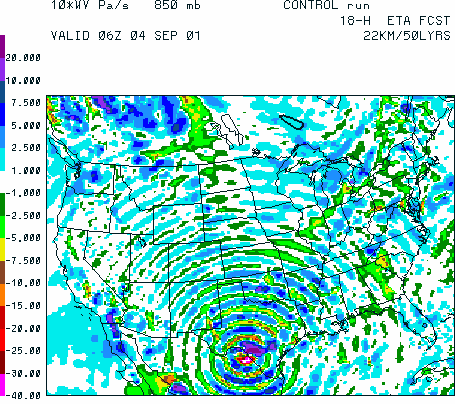
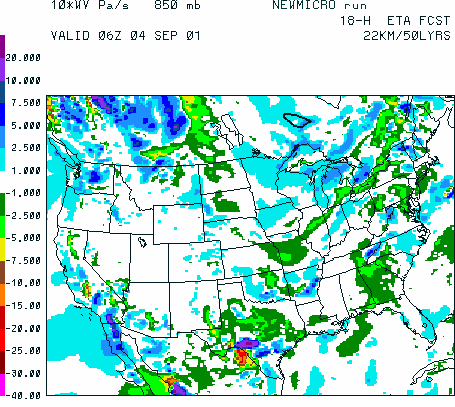
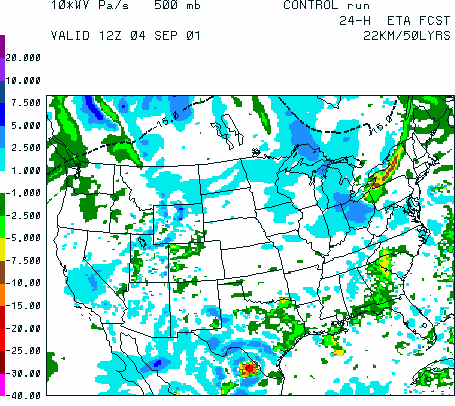
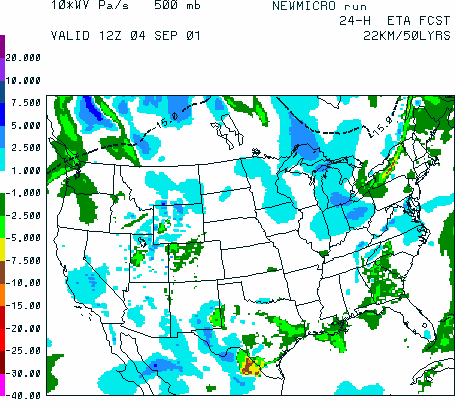
Figure 3.11(a) Similar to Fig. 3.10, except that vertical motion fields are shown
from 22-km forecasts for the operational control (left) and the new grid-scale
microphysics (right). In (a) 12-h forecasts of the 200-mb vertical motion fields valid
at 00Z on 4 September 2001 show spurious gravity waves in the control run emanating from
heavy grid-scale precipitation over southwestern Texas (left), which is absent in the run
using the new grid-scale microphysics.
Figure 3.11(b) Same as (a) except at 500 mb.
Figure 3.11(c) Same as (a) except at 850 mb. Panels (a)-(c) show that the
gravity waves in the operational control extend throughout most of the troposphere
if the forcing is sufficiently strong and deep.
Figure 3.11(d) Same as (b) except for the 18-h forecast.
Figure 3.11(e) Same as (c) except for the 18-h forecast.
Figure 3.11(f) Same as (b) except for the 24-h forecast. As in the 10-km runs,
there is much less spurious gravity-wave activity by this time with only minor evidence
of their presence.
