The Community Multiscale Air Quality Modeling System

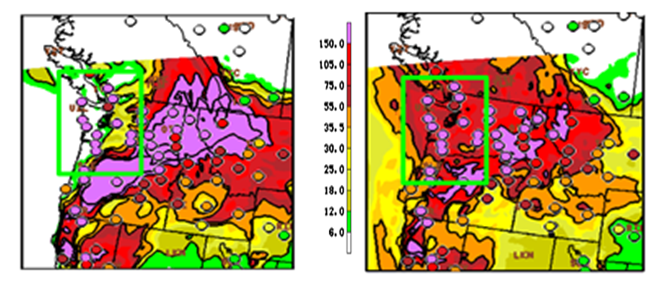
Above: Day 1 PM2.5 forecasts from the previous ops AQMv5 (left) and current (as of July 2021) ops AQMv6 (right) for the historic Pacific NW fires in Sept 2020. The current operational AQMv6 correctly captured the high 24h PM2.5 exceedances along the Oregon/Washington coasts.
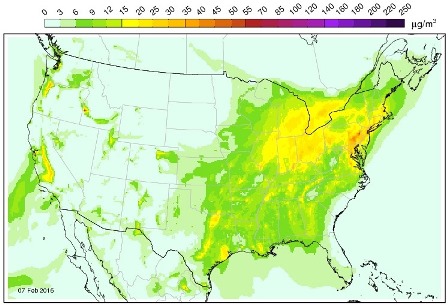
Operational NOAA-EPA National Air Quality Forecast Capability (NAQFC) ozone and fine particulate matter
(PM2.5) predictions are produced twice daily to 72 forecast hours for the 06 and 12 UTC run cycles. The
system consists of the Community Multiscale Air Quality (CMAQ) model, which is driven by the NCEP Global
Forecast System meteorological model (GFS).
The operational CMAQ v6.0.6 running at NCEP uses CB05 chemical
mechanism, the AERO-VI aerosol chemistry, latest point sources emissions, updated EPA National Emissions Inventory from 2016
(NEI 2016) area and mobile sources and Biogenic Emissions Inventory System that uses the updated Biomass Emission Land
Database (BELD) v5. Aerosol lateral boundary conditions are provided by the NWS GEFS-Aerosol global 4x/day
predictions. Bias-corrected ozone and PM2.5 predictions are also produced using the ESRL analog Kalman Filter method,
which has been improved to use a consistent training data set, additional monitor sites, and a unified KFAN bias
correction system. The Air Resources Laboratory (ARL) Fengsha dust model has been updated with
improved threshold velocities by soil type. Greenness vegetation fraction (GVF) are updated daily
with a 7-day average GVF provided by the National Environmental Satellite, Data, and Information Service (NESDIS) satellite
products, and the Leaf Area Index (LAI) are updated from a constant value in time and space to a
climatological field. The NESDIS Global Biomass Burning Emissions Product eXtended
(GBBEPx) product are used to initialize fire particulate and gas-phase emissions and its associated Fire Radiative Power,
which is used to drive fire smoke plume rise. Both GVF and LAI are used for biogenic and deposition processes and should result
in better land-related processes.
The AQ model operational predictions are displayed by the National Weather Service's National Digital Forecast Database (NDFD), showing 1-hr/8-hr averages and daily maxima of 1-hr/8-hr averages of ozone. In addition, operational ozone predictions and testing of PM2.5 predictions are displayed at the links provided below.

 OZONE/PM FORECAST GRAPHICS
 NAQFC VERIFICATION
 GLOBAL ATMOSPHERIC COMPOSITION FORECASTS
 NCEP NWP MODELS
 SMOKE/DUST FORECAST TOOL LINKS
 AQFC CHANGE LOG
AIR QUALITY FORECAST LINKS

